The S&P 500 has rallied more than 35% off its March low. For some, considering the current economic data cataloguing the wreckage of the coronavirus-induced economic shutdown, the move appears to defy common sense. It has prompted many to ask whether financial markets are ahead of the economy, and whether they should be? At the risk of spoiling the end, the answer to both those questions is yes! The next question should be, what economic scenario are financial markets anticipating, or discounting into future cash flows?
It is generally accepted that investors discount, or take into consideration, all available information including present and potential future events. This means security (bond and equity) prices reflect significant amounts of expectation about company earnings, defaults, inflation and monetary and fiscal policy. A consequence of ultra-low interest rates and bond yields is that the proportion that longer-term expectations contribute to current security prices is potentially higher than they traditionally would be in a higher rate regime.
While it is arithmetically correct that current security prices largely convey forward-looking expectations, they also reflect views about the current robustness of corporate liquidity and balance sheets, or the stability of the financial system generally. Admiring a building without understanding the strength of its foundation is folly.
The valuations of companies listed on the world’s stock exchanges are often multiples of those companies’ expected annual profits. Figure 1 shows the range of price-to-earnings (P/E) ratios investors have been willing to pay in various markets over multiple years. As the P/E ratio is never 1, investors appear willing to consider multiples years into the future.
Figure 1: Equity market valuations, past and present
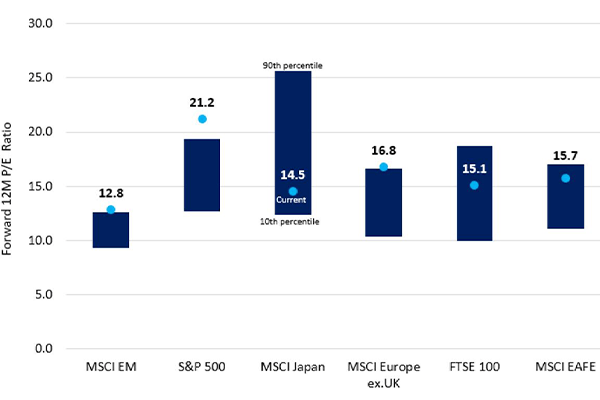
Source: I/B/E/S and Columbia Threadneedle Investments. The bar represents the 10th to 90th percentile range of forward 12-month price to earnings (P/E) multiples over the past 20 years (to 31 May 2020) in each of the indices indicated. The dot represents the 12-month forward P/E multiple as of 31 May 2020.
When unexpected major developments occur, investors tend to move rapidly, attempting to incorporate the new information into security prices. The efficient market hypothesis assumes investors as a group (the market) are a very efficient discounting mechanism. If efficiency is defined as the speedy consideration of all new, public, accurate information then I agree markets are efficient.
As an example, when an individual company publicly announces profit forecasts, the possible range of interpretations by investors is relatively narrow, so the adjustment to the valuation of related securities is fast and accurate. However, in a more complex situation, such as a global pandemic or worldwide financial crisis, investors act quickly but there are a wide range of interpretations – both short and long term. Social media has facilitated a vast increase in the speed and amount of opinion and theory (though not necessarily facts) that are circulated. Consequently, it is less clear that the initial market reaction is an accurate reflection of the eventual consequences.
The speed of reaction is clear. The rapid rise in volatility, coinciding with the emergence of major unexpected events, is evident in the charts below (Figure 2). Technically, volatility is a statistical measure of the dispersion of returns of a security or market index over time. Practically, it is a barometer of investor uncertainty over the immediate and longer-term implications.
Figure 2: Volatility shocks arise quickly but can also dissipate quickly
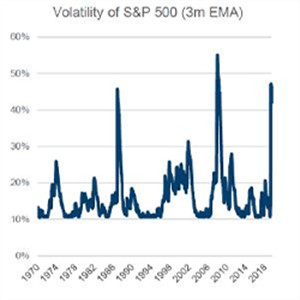
Source: S&P Global/Columbia Threadneedle Investments. Exponential moving average (EMA) places a greater weight on the most recent data points.
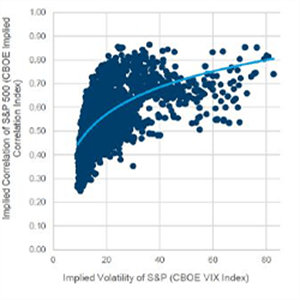
Source: Chicago Board Options Exchange/Columbia Threadneedle Investments. Based on values for the period 1 January 2007 to 28 May 2020. Each dot represents a daily value. The CBOE VIX Index measures equity market volatility. The CBOE Implied Correlation Index measures the average correlation of the stocks that comprise the S&P 500 Index.
As Toby Nangle, Global Head of Asset Allocation, asks in a recent viewpoint1, how much of the decline in equity markets or the jump in corporate bond yields in the current crisis was associated with an informed rise in investor expectations of the future (deteriorating economic conditions, worsening credit metrics and rising default rates), and how much was associated with contemporaneous financial market liquidity distress that central banks have sought to offset?
He goes on to say: “The two are interrelated and the question cannot be answered in black and white. But, if risk premia are high because they are pricing the future collapse in economic activity that will cause businesses to declare bankruptcy en masse, security prices may very well be rich. While if risk premia reflect simply the brokenness of the financial system, there may be opportunities for medium-term investors. Because while central banks cannot obviate default risk, they can fix a broken financial system – it is part of their mandates and they have unlimited firepower at their disposal.”
Note the speed of increase in volatility and the subsequent decline in the chart on the left above. The fast, initial response appears to reflect the level of surprise and the initial perception of the scale of the issue as it emerges. The slower decline in volatility appears to reflect time taken for consensus to emerge over the eventual outcome.
Equity market indices do not fully reflect the range of activities in the broad economy, but over time we expect markets to generally move in the same direction as economic data. After all, companies (and their revenue) do not occur in a vacuum. When global economies are growing, more goods and services are sold, enhancing corporate revenues and creating the circumstances that tend to foster stock and corporate-bond appreciation. In contrast, if there is a downward trend in the economy, there is a chance the stock market will follow suit.
However, because of the concept of discounting, financial markets may rise when there is an expectation of future economic growth, even if the current situation is dire. Investors experienced this phenomenon when the stock market crashed due to the global financial crisis in 2008, but began recovering in 2009 before the economy recovered.
Figure 3: The interplay of infection and economic activity
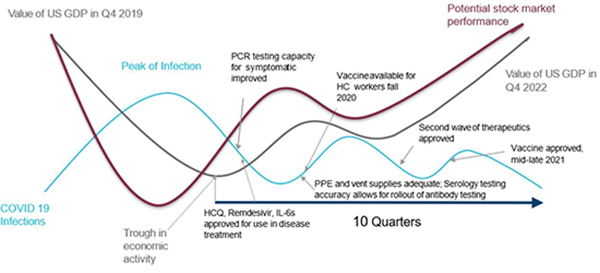
Source: Columbia Threadneedle Investments as at June 2020.
As noted, investors tend to have imperfect foresight when the range of future outcomes is uncertain. Figure 3 shows our assumptions on how the US economy is most likely to recover from the Covid-19-induced economic recession. A critical element of the chart is our assumptions, informed by our healthcare research team, about developments in healthcare that will enable normalisation of economic activity in aggregate. The red line illustrates how we believe the stock market will move in anticipating these economic and healthcare changes. The key point is that the market moves in advance of the economic and healthcare advances, not concurrent with them.
Financial markets are, and should be, anticipating the size and growth rate of global economies in 2021 and 2022 rather than focusing on dire current economic reports that are backward looking. In order to develop and test our recovery hypothesis, in addition to broad economic assumptions, Columbia Threadneedle Investments will focus its macro research on the outlook for other specific factors including, but not limited to, inflation and consumer spending preferences. While aggregate demand may recover, it is vital to understand whether there will be permanent changes to what consumers purchase. Meaningful forecasts must also include a deep understanding of current corporate financial strength as well as future revenue and profit growth and the health of local authorities.
Once formed, we can test our economic/healthcare recovery hypothesis against the actual pace of economic recovery, and consequently frame the implied expectations embedded in the US equity market. Using the S&P 500 Index as a proxy for the US stock market, investors appear to be increasingly confident of one of two economic scenarios – either a V- or U-shaped recovery – and the key assumptions on healthcare that accompany them. At Columbia Threadneedle, we attach the highest probability for the path of the US economy to the stylized U-shape (Figure 4), although the probability attached to a slower L-shaped recovery is material.
Figure 4: US stylised economic growth scenarios and probabilities
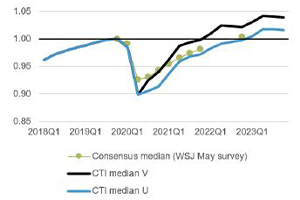
Source:Columbia Threadneedle Investments (CTI)/Wall Street Journal (WSJ). The WSJ surveys more than 60 economists on major economic indicators on a monthly basis. Y-axis is the level of GDP and 2019Q4 level = 1. CTI median represents an internal survey of investment strategists.
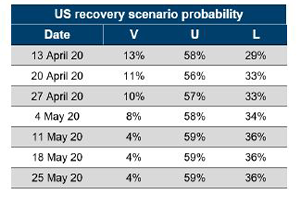
Source: Columbia Threadneedle Investments; represents probability of shape recovery based on weekly internal surveys of investment strategists.
However, we are less optimistic about Europe where we attach the highest probability to the L-shape (Figure 5)
Figure 5: Europe stylised growth scenarios and probabilities
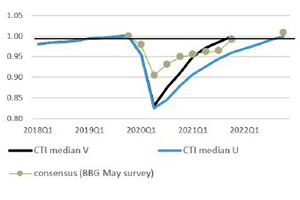
Source: Columbia Threadneedle Investments; Bloomberg (BBG). Bloomberg surveys 70 of the nation’s economists on their economic and interest rate outlook on a monthly basis. Y-axis is the level of GDP and 2019Q4 level = 1. CTI median represents an internal survey of investment strategists
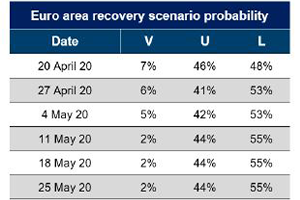
Source: Columbia Threadneedle Investments; represents probability of shape recovery based on weekly internal surveys of investment
Given these relatively modest probability-adjusted assumptions for the path of economic recovery in the US and Europe, Ed Al-Hussainy, Head of Macro Research, forecasts that there will only be modest rises in interest rates and bond yields in both regions.
Regardless of the path of economic and financial market recovery from Covid-19, we must not forget that prior to the pandemic developed economies were in a long-term trend of relatively low growth caused by multi-year trends in demographics, high debt levels etc. The pandemic may affect some trends on consumer spending, corporate globalisation, higher debt levels and public policy initiatives, but it is unlikely to accelerate aggregate demand from the trend of the past few decades.
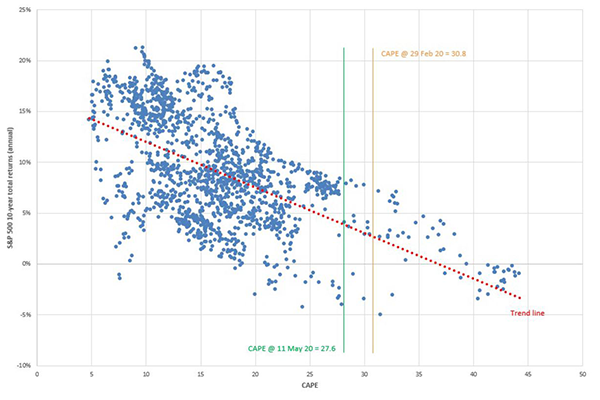
If we combine the long-term economic outlook with a relatively high starting point for equity-market valuations, based on the cyclically adjusted P/E ratio (CAPE), a measure created by John Campbell and Robert Shiller, then expected market returns may be modest compared to history. In Figure 6 we can see that the CAPE was at 27.6 in early May. Based on this value, forward 10-year returns on the S&P 500 have generally been less than 10% and negative in some cases. We expect average returns over the next 10 years of 4%-6% within a range of -2%-8%.
Figure 6: Cyclically adjusted price earnings ratio (CAPE) and 10-year forward total returns
Source: Columbia Threadneedle Investments; Robert Shiller/Yale University.
However, broad market valuations can be deceiving. According to Empirical Research, “Big Growers, the 75 large-cap stocks with the very best all-around growth credentials, are now trading at almost five times the market’s trailing-P/E on an equal-weighted basis, a valuation last seen in December 1999. They’ve had an extraordinary pandemic, outperforming the market by double-digits on the way down and again on the way back up”. Therefore, perceptions of market performance and valuation may be skewed by investor admiration for companies with visible growth prospects in a growth-starved world, rather than an abundance of optimism about the recovery from Covid-19. Consequently, in a U-shaped recovery the distortions created by this skew may create greater opportunity for security selection outside these few large-cap stocks.
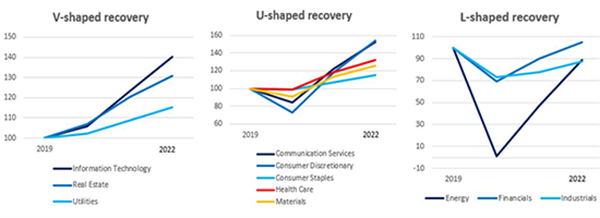
Figure 7 shows that investors have differentiated in considering the future of different industries/sectors. Clearly, investors have taken a view of how the economic recovery from the pandemic-induced shutdown will affect different industries’ earnings recovery, with some fitting into each of the “U”,”V”, or “L” scenarios. When disaggregated this way, investors appear to be acting more rationally than some observers focusing on the market averages are indicating.
Figure 7: S&P 500 implied recovery by industry (based on EPS estimates)
Source: Bloomberg Consensus, Columbia Threadneedle Investments research
Investors may be too optimistic about which industries will experience a faster recovery, but there appears to be as much opportunity to rebalance views within the market as there is a need for market averages to fall materially.
Conclusion
The future is capricious, which is why forecasting is very hard and partly why financial markets exist in the first place. We should expect markets to try to anticipate complex future events but experience additional volatility as those expectations change with events. An irrational market would be one that does not attempt to discount the future.


